The pandemic-induced demand for housing could finally be slowing with rising rates and a slowdown of demand. Today’s FA Alpha Daily will investigate the S&P Homebuilders ETF (XHB) now that demand is at its lowest.
FA Alpha Daily:
Friday Portfolio Analysis
Powered by Valens Research
In the midst of the pandemic, one purchase defined the world we talked about the past two years.
Folks’ homes quickly became their place of work and dining as the pandemic fully took root.
The necessity to bunker down and isolate from others meant that many had to reimagine the different purposes of their home.
We talked about the resulting At-Home Revolution and how investments at home for those seeking to escape their city apartments meant a transformation in consumption.
The quick surge in demand for homes, combined with access to cheap capital due to historically low interest rates, meant that house prices surged.
Over the course of the pandemic, this has meant home prices have risen dramatically, impacting affordability. Now, with interest rates on the rise and bound to rocket higher, many are souring on buying a home.
In fact, homebuilder sentiment has dropped to its lowest level in seven months, with surging costs leading many to believe we have seen the inflection point in home demand.
On the other hand, U.S. housing inventory is still at record lows, which could indicate the housing market could have legs despite rate hikes. Zillow reported that U.S. inventory sank to 729,000 home listings in February.
This is down a full 25% from February 2021, and an even steeper contraction of 48% since February 2020. With total housing inventory continuing to shrink, housing prices may still be buoyed by a simple lack of supply, even as demand tapers off.
With the market for homebuilders at such a dramatic turning point, now is a good time to take a look at the performance, growth, and valuations of the overall Homebuilders ETF. That way, we can get a sense of what Wall Street and the markets are pricing into the future of U.S. homebuilders.

Economic productivity is massively misunderstood on Wall Street. This is reflected by the 130+ distortions in the Generally Accepted Accounting Principles (GAAP) that make as-reported results poor representations of real economic productivity.
These distortions include the poor capitalization of R&D, the use of goodwill and intangibles to inflate a company’s asset base, a poor understanding of one-off expense line items, as well as flawed acquisition accounting.
It is no surprise that once many of these distortions are accounted for, it becomes apparent which companies are in reality robustly profitable and which may not be as strong of an investment.
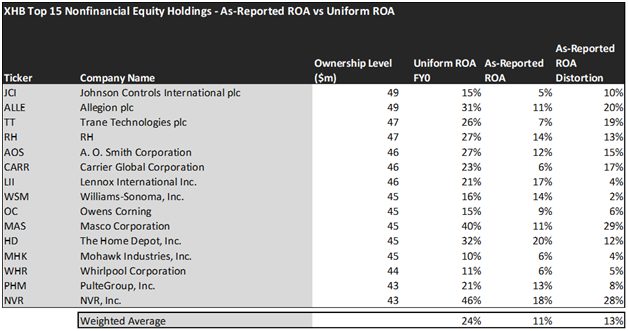
Contrary to what one might expect with the drop off in home demand in the past few months, most of the holdings in the S&P Homebuilders ETF remain in a better position than you would expect.
The average as-reported ROA among the S&P Homebuilders ETF top 15 names is around the market average at 11%. In reality, though, these companies perform more like a much more profitable company, with a 24% Uniform ROA.
One of the fund’s largest holding RH (RH) for example, doesn’t return an average 14%. It actually provides drastically stronger returns, at a 27% Uniform ROA which takes into account their strong home revolution tailwinds from the pandemic.
Some of its other investments are also much stronger than they appear. For example, Carrier Global Corporation (CARR) does not have 6% returns. Rather, it has a 23% Uniform ROA.
Furthermore, Trane Technologies (TT) doesn’t have a cost of capital return of 7%. Rather, it has immensely strong returns of 26%.
Largely, once we account for Uniform Accounting adjustments, we can see that many of these companies are strong stocks that are priced to grow at strong rates or are fairly priced.
These dislocations demonstrate that most of these firms are in a different financial position than GAAP may make their books appear. But there is another crucial step in the search for alpha. Investors need to also find companies that are performing better than their valuations imply.
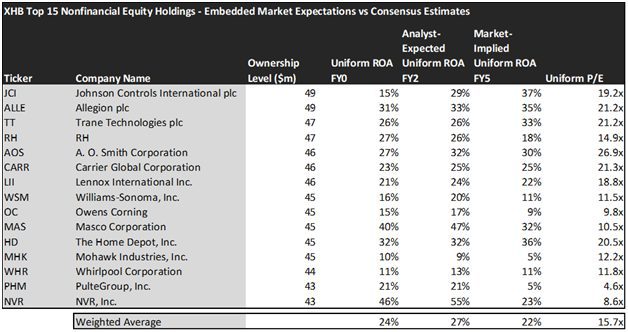
Valens has built a systematic process called Embedded Expectations Analysis to help investors get a sense of the future performance already baked into a company’s current stock price. Take a look:

This chart shows four interesting data points:
- The Uniform ROA FY0 represents the company’s current return on assets, which is a crucial benchmark for contextualizing expectations.
- The analyst-expected Uniform ROA represents what ROA is forecasted to do over the next two years. To get the ROA value, we take consensus Wall Street estimates and we convert them to the Uniform Accounting framework.
- The market-implied Uniform ROA is what the market thinks Uniform ROA is going to be in the three years following the analyst expectations, which for most companies here is 2023, 2024, and 2025. Here, we show the sort of economic productivity a company needs to achieve to justify its current stock price.
- The Uniform P/E is our measure of how expensive a company is relative to its Uniform earnings. For reference, average Uniform P/E across the investing universe is roughly 24x.
Embedded Expectations Analysis of the S&P Homebuilders ETF paints a clear picture of the fund. The stocks it tracks are projected by analysts to slightly improve their already strong returns. However, the market is pricing these companies to experience a drop in profitability.
Unlike analysts that are expecting average ROA to increase to 27%, the market is pricing these companies to drop their economic profitability to 22%.
Williams-Sonoma (WSM) is poised to continue its gain in profitability with analyst expectations of 20% ROA and market expectations of 11%.
Similarly, Masco Company (MAS) could also provide some dramatic upside for the portfolio. With the market implying Uniform ROA to fall to 32%, analyst expectations of 47% ROA could help the ETF continue its ascent.
While the market is caught up in the story of rate hikes slowing housing growth, perhaps Wall Street analysts are able to peel back the curtain and see with record low housing supply in the U.S., the homebuilders will continue to have demand.
This just goes to show the importance of valuation in the investing process to understand the underlying story. Finding a company with strong growth is only half of the process. The other, just as important part, is attaching reasonable valuations to the companies and understanding which have upside which have not been fully priced into their current prices.
To see a list of companies that have great performance and stability also at attractive valuations, the Valens Conviction Long Idea List is the place to look. The conviction list is powered by the Valens database, which offers access to full Uniform Accounting metrics for thousands of companies.
Click here to get access.
Read on to see a detailed tearsheet of the largest holding in the S&P Homebuilders ETF.
SUMMARY and Johnson Controls International plc Tearsheet
As XHB’s largest individual stock holdings, we’re highlighting Johnson Controls International plc (JCI:USA) tearsheet today.
As the Uniform Accounting tearsheet for Johnson Controls highlights, its Uniform P/E trades at 19.2x, which is below the global corporate average of 24.0x and its historical average of 23.2x.
Low P/Es require low EPS growth to sustain them. In the case of Johnson Controls, the company has recently shown a Uniform EPS shrinkage of 22%.
Wall Street analysts provide stock and valuation recommendations that, in general, provide very poor guidance or insight. However, Wall Street analysts’ near-term earnings forecasts tend to have relevant information.
We take Wall Street forecasts for GAAP earnings and convert them to Uniform earnings forecasts. When we do this, Johnson Controls’ Wall Street analyst-driven forecast is for EPS to grow by 109% in 2022 and 21% in 2023, respectively.
Based on the current stock market valuations, we can use earnings growth valuation metrics to back into the required growth rate to justify Johnson Controls’ $65 stock price. These are often referred to as market embedded expectations.
The company is currently being valued as if Uniform earnings were to grow by 10% annually over the next three years. What Wall Street analysts expect for Johnson Controls’ earnings growth is above what the current stock market valuation requires through 2023.
Meanwhile, the company’s earning power is 2x above the long-run corporate averages. Also, cash flows and cash on hand are around 2x above total obligations—including debt maturities and capex maintenance. Moreover, intrinsic credit risk is 40 bps. Together, these signal low dividend and credit risks.
Lastly, Johnson Controls’ Uniform earnings growth is above its peer averages, but is trading below its average peer valuations.
Best regards,
Joel Litman & Rob Spivey
Chief Investment Strategist &
Director of Research
at Valens Research
This portfolio analysis highlights the same insights we use to power our FA Alpha product. To find out more visit our website.


